• About Nuricon
    • Overview
    • Business
    • History
    • Certificates & Patents
    • Contact
  • Prodcuts
    • IP Wall
    • Signage
    • Encoder
    • Streaming Server
  • Service
    • Video Control System
    • Digital Signage System
  • Resources
    • Customers
    • Case Study
    • Demonstration
    • Download
  • ESG
    • Environmental Management
    • Social Contribution
    • Human Rights
  • Contact Us
Environmental Management
ESG Environmental Management    Share
  • Slogan
  • Green Policy & Plan
  • Green Technology

" Green Value Beyond IT "

Business activities in which a company takes the lead in environmental protection,
conducts social contribution activities for the socially underprivileged and
strictly complies with laws and ethics

  • - Green Policy
  • Operation of management system for environment, safety and health
  • Compliance with environmental and safety laws and other requirements
  • Setting and achieving plan and detailed goals
  • Education and training for all members of the organization with documents
  • - Environmental Goals
  • Reducing energy waste emissions
  • - Environmental Plan
  • Continuous reduction of energy consumption
  • Continuous reduction of waste emissions
  • - Environmental education and training
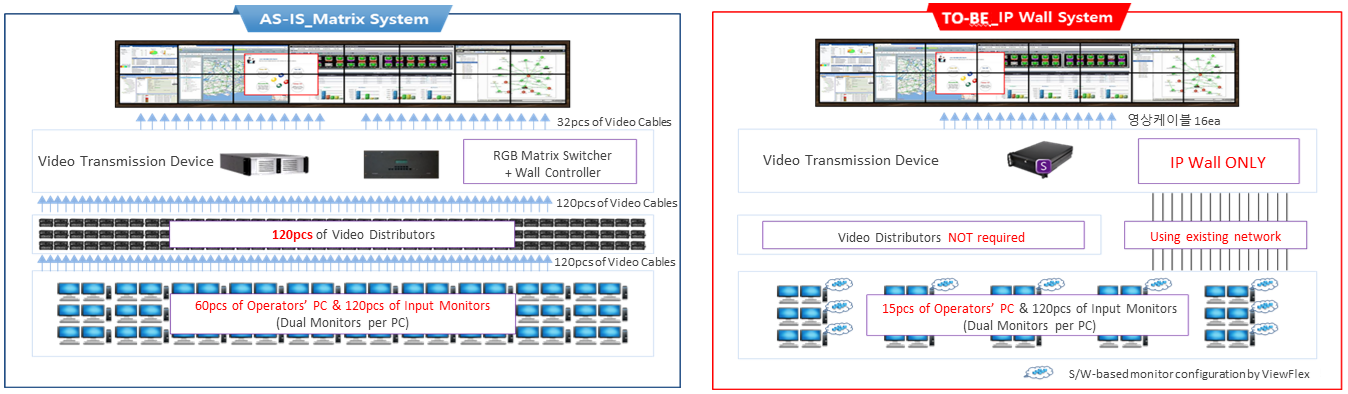
Old (Existing Matrix) vs. New (Nuricon’s IP Wall System) – Field reference with 16 displays and 60 operators 24/7/365
img
Device Power Consumption (W/h) Saving
AS-IS (Matrix System) TO-BE (IP Wall System)
Q’ty (pcs) Power Consumption (W) Sub-Total (W) Q’ty (pcs) Power Consumption (W) Sub-Total (W)
Situation Board (50-inch DLP CUBE) 16 200 3,200 16 200 3,200 Same
RGB Matrix Switcher (120-in & 16-out) 1 150 150 0 0 0 150W ↓
Wall Controller 1 850 850 1 850 850 Same
Operator PC (Dual-monitor) 60 500 30,000 15 500 7,500 22,500W ↓
PC Interface 120 2.5 300 0 0 0 300W ↓
Total Power Consumption (W) 34,500W 11,550W 22,950W ↓
Power Consumption per annum (24/7/365) 302,220kW / year 101,178 kW / year 201,042 kW / year
CO₂ Emission per annum (tCO₂ 24/7/365) 126.932 tCO₂ / year 42.494 tCO₂ / year 84.4376 tCO₂ / year

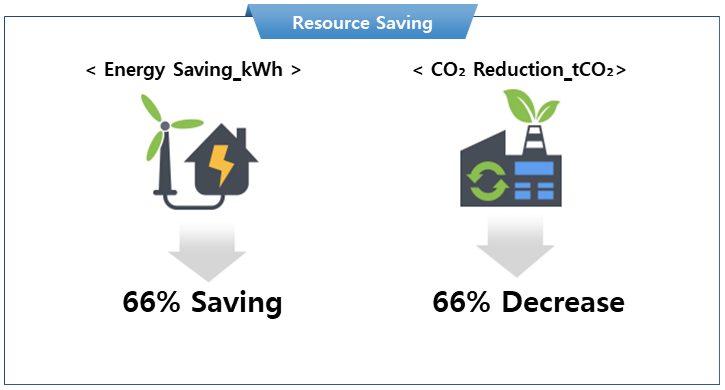
Effect of Energy Saving

Power Consumption 201,042 kW↓/year
CO₂ Emission 84.4376 tCO₂↓/year
Electric Charge (USD) $20,615↓/year
Reduction Rate
66% ↓
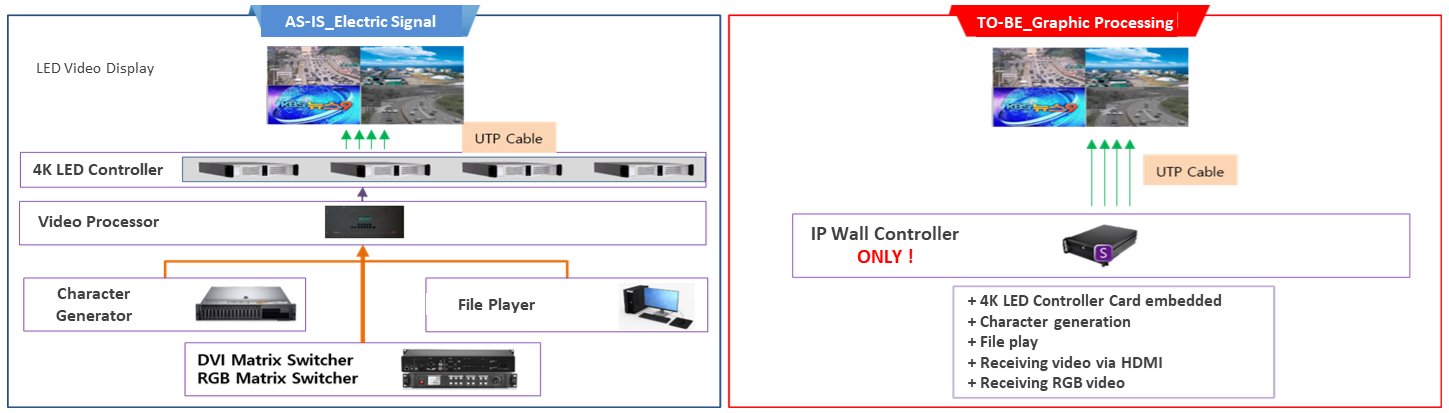
Old (Existing) vs. New (Nuricon’s IP Wall System) – IP Wall Controller for LED Display
img
Device Power Consumption (W/h) Saving
AS-IS (Matrix System) TO-BE (Parallel Distributed Rendering)
Q’ty (pcs) Power Consumption (W) Sub-Total (W) Q’ty (pcs) Power Consumption (W) Sub-Total (W)
LED Controlle 4 30 120 0 30 0 120W ↓
HDMI Matrix Switcher 1 40 40 0 40 0 40W ↓
Character Generator 1 600 600 0 600 0 600W ↓
Video Processor 1 826 826 0 826 0 826W ↓
Workstation & Monitor 1 550 550 0 550 0 550W ↓
IP Wall Controller 0 850 0 1 850 850 Same
Total Power Consumption (W) 2,136W 850W 1,286W ↓
Power Consumption per annum (24/7/365) 18,711.36 kW/year 7,446 kW/year 11,265 kW/year
CO₂ Emission per annum (tCO₂ 24/7/365) 7.858 tCO₂/year 3.127 tCO₂/year 4.731 tCO₂/year

Effect of Energy Saving

Power Consumption 11,265 kW↓ / year
CO₂ Emission 4.731 tCO₂ ↓ / year
Electric Charge (USD) $2,538 ↓ / year
Reduction Rate
60% ↓
Nuricon’s Energy-Saving Technology for Green Growth

img img img
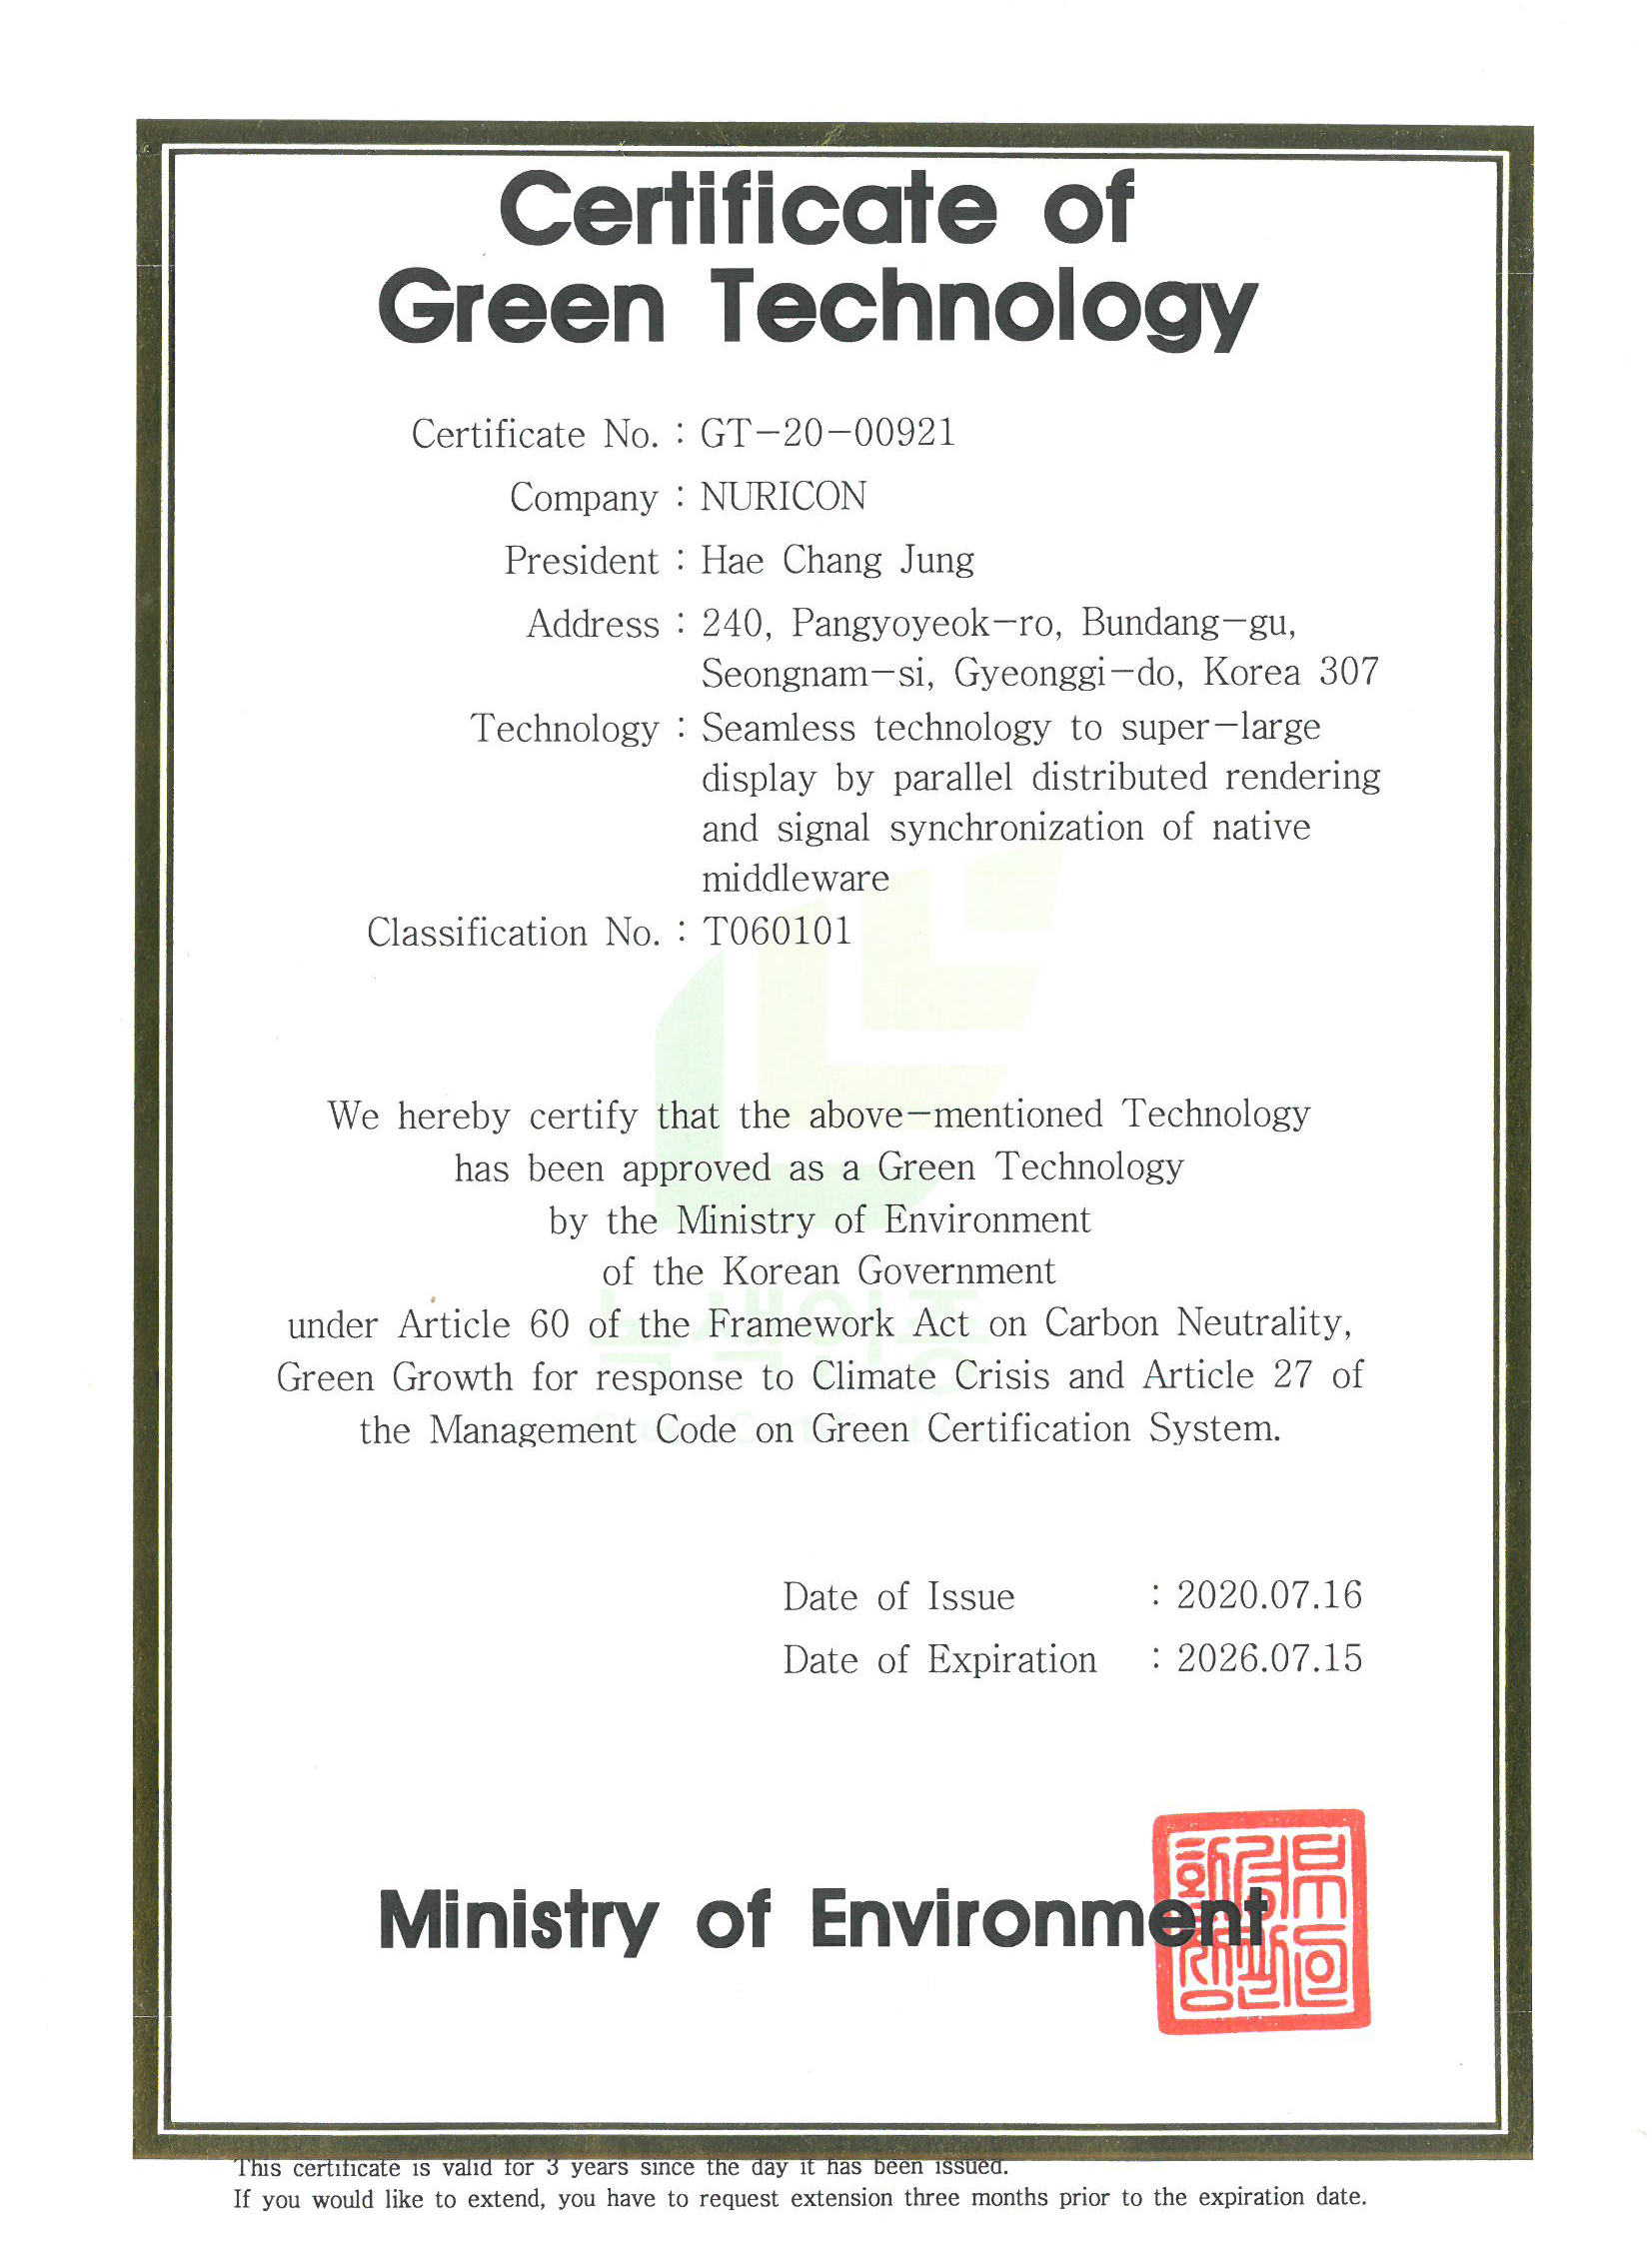
Certificates for Green Technology with eco-friendly technology of Nuricon
img